Product

STREAM HEALTH, CHESAPEAKE BAY WATERSHED

$0.00
Available

Product Details

Product Number
534322
Series
FS-2023-3003
Scale
NO SCALE
Alternate ID
FS-2023-3003
Authors
CHRIS A MASON
Version Date
06/01/2023
Countries
USA
Media
WEB ONLY
Format
WEB ONLY

Additional Details

Description
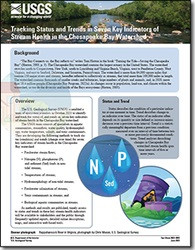
Tracking Status and Trends in Seven Key Indicators of Stream Health in the Chesapeake Bay Watershed

Fact Sheet 2023-3003

National Cooperative Geologic Mapping Program

By: Samuel H. Austin, Matt J. Cashman, John Clune, James E. Colgin, Rosemary M. Fanelli, Kevin P. Krause, Emily H. Majcher, Kelly O. Maloney , Chris A. Mason, Doug L. Moyer, and Tammy M. Zimmerman

https://doi.org/10.3133/fs20233003

This product is not available for order, it can only be downloaded from here (click on image) or within the Publications Warehouse at https://pubs.usgs.gov/publication/fs20233003

For additional information, contact:

Director, Virginia and West Virginia Water Science Center

https://www.usgs.gov/programs/national-cooperative-geologic-mapping-prog ram

https://www.usgs.gov/centers/va-wv-water

U.S. Geological Survey

1730 East Parham Road

Richmond, Virginia 23228

Abstract

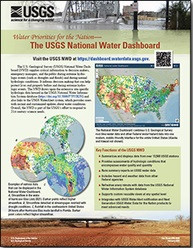
“The Bay Connects us, the Bay reflects us” writes Tom Horton in the book“Turning the Tide—Saving the Chesapeake Bay”. The Chesapeake Bay watershed contains the largest estuary in the United States. The watershed stretches north to Cooperstown, New York, south to Lynchburg and Virginia Beach, Virginia, west to Pendleton County, West Virginia, and east to Seaford, Delaware, and Scranton, Pennsylvania. The watershed is more than 64,000 square miles that contain 150 major rivers and streams, hereafter referred to collectively as streams, that total more than 100,000 miles in length. The watershed contains thousands of smaller creeks and tributaries, large numbers of plants and animals, and, in 2020, more than 18.4 million people. As changes occur in population, land use, and climate within the watershed, so too do the diversity and health of the Bay's ecosystems.

Survey Date
2023
Print Date
2023
Height In Inches
11.000
Length In Inches
8.500
Languages
English
Related Items
THE USGS NATIONAL WATER DASHBOARD
<p> Water Priorities for the Nation—The USGS National Water Dashboard <p> </p> <font color=red><i> <p> This product is not available for order, it can only be downloaded from here (click on image) or within the Publications Warehouse at https://pubs.er.usgs.gov/publication/fs20223003 </p> </i> </font> <p> <p> First posted March 2, 2022 <p> For additional information, contact: Associate Director, Water Resources Mission Area https://www.usgs.gov/mission-areas/water-resources U.S. Geological Survey 12201 Sunrise Valley Drive Reston, VA 20192 <p> <p> Abstract <p> <p> The U.S. Geological Survey National Water Dashboard supplies critical information to decision makers, emergency managers, and the public during extreme hydrologic events (such as droughts and floods) and during normal hydrologic conditions. It informs decision making that can help protect lives and property before and during extreme hydrologic events. The National Water Dashboard draws upon the extensive site-specific hydrologic data housed in the U.S. Geological Survey National Water Information System database (https://doi.org/10.5066/F7P55KJN) and also links to the U.S. Geologic Survey WaterAlert system, which provides users with instant and customized updates about water conditions. Overall, the National Water Dashboard is part of the U.S. Geological Survey's effort to respond to 21st century science needs. <p>
WHISPERS PROVIDING SITUATIONAL AWARENESS
<p> WHISPers—Providing Situational Awareness of Wildlife Disease Threats to the Nation—A Fact Sheet for the Biosurveillance Community <p> </p> <font color=red><i> <p> This product is not available for order, it can only be downloaded from here (click on image) or within the Publications Warehouse at https://pubs.er.usgs.gov/publication/fs20223022 </p> </i> </font> <p> <p> First posted July 21, 2022 <p> For additional information, contact: Director, National Wildlife Health Center National Land Imaging Program https://www.usgs.gov/centers/nwhc <p> U.S. Geological Survey <p> 6006 Schroeder Road <p> Madison, WI 53711-6223 <p> <p> Abstract <p> <p> Solutions for emerging infectious disease and bioterror threats can be improved by incorporating integrated biodefense strategies, including improved surveillance for animal and zoonotic diseases, strong national leadership, and effective management tools. Active biosurveillance for disease events is key to early detection, warning, and overall situational awareness and enables better communication, coordination, decision making, and data-driven responses. The national biosurveillance infrastructure has well-established channels for human and domestic animal health data through the Centers for Disease Control and Prevention and U.S. Department of Agriculture, and State, county, and local authorities. Wildlife disease information, however, has been more challenging to acquire and access, in part, due to the comparatively small infrastructure and resources dedicated to wildlife health and also because regulatory authority for wildlife and wildlife health is split among Federal, State, Tribal, and indigenous natural resource authorities. To address these issues, the Wildlife Health Information Sharing Partnership-event reporting system (WHISPers; https://whispers.usgs.gov) was developed by the U.S. Geological Survey National Wildlife Health Center to promote collaboration and sharing of wildlife health information and to provide situational awareness and timely information about wildlife disease threats. WHISPers is a free science gateway and data portal that provides interactive query, display, reporting, and export capabilities for wildlife health event summary information. <p>
MULTISCALE APPROACH MONITORING GROUNDWAT
<p> A Multiscale Approach for Monitoring Groundwater Discharge to Headwater Streams by the U.S. Geological Survey Next Generation Water Observing System Program—An Example From the Neversink Reservoir Watershed, New York <p> </p> <font color=red><i> <p> This product is not available for order, it can only be downloaded from here (click on image) or within the Publications Warehouse at https://pubs.er.usgs.gov/publication/fs20223077 </p> </i> </font> <p> <p> First posted October 25, 2022 <p> For additional information, contact: <p> Program Manager, Next Generation Water Observing System <p> https://www.usgs.gov/mission-areas/water-resources/science/ next-generation-water-observing-system-ngwos <p> Water Resources Mission Area <p> U.S. Geological Survey <p> 12201 Sunrise Valley Drive <p> Reston, VA 20192 <p> <p> Abstract <p> <p> Groundwater-stream connectivity across mountain watersheds is critical for supporting streamflow during dry times and keeping streams cool during warm times, yet U.S. Geological Survey (USGS) stream measurements are often sparse in headwaters. Starting in 2019, the USGS Next Generation Water Observing System Program developed a multiscale methods and technology testbed approach to monitoring groundwater discharge to streams in the Neversink Reservoir watershed in the Catskill Mountains of New York. Groundwater discharge dynamics are complex across space and time because of geographic variability, topography, and preferential groundwater flow patterns, and the monitoring of discharge processes necessitates an innovative approach that includes emerging water tracing methods and enhanced local geologic mapping. This fact sheet describes the multiscale monitoring approach applied in the Neversink Reservoir watershed and specifically how the varied data types are complimentary in understanding groundwater-stream connectivity, with elements transferable to other mountain watersheds. <p>