Product

REVIEW OF STUDIES SAN FRANCISCO BAY, CA

$7.50
Available

Product Details

Product Number
14920
Series
CIR-1015
Scale
NO SCALE
Alternate ID
21-1015
ISBN
978-0-607-72588-9
Authors
SMITH, LAWRENCE H.
Version Date
01/01/1987
Media
Paper
Format
Flat
Digital Reproduction
Yes

Additional Details

Description
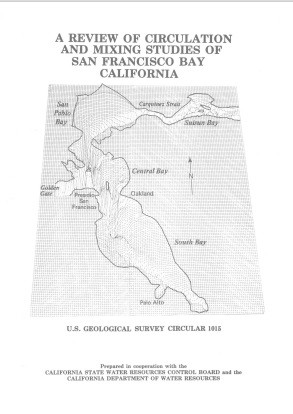
A review of circulation and mixing studies of San Francisco Bay, California

Abstract

A description of the major characteristics and remaining unknowns of circulation and mixing in San Francisco Bay has been constructed from a review of published studies. From a broad perspective San Francisco Bay is an ocean-river mixing zone with a seaward flow equal to the sum of the river inflows less evaporation. Understanding of circulation and mixing within the bay requires quantification of freshwater inflows and ocean-bay exchanges, characterization of source-water variations, and separation of the within-bay components of circulation and mixing processes. Description of net circulation and mixing over a few days to a few months illustrates best the interactions of major components. Quantification of tidal circulation and mixing is also necessary because net circulation and mixing contain a large tide-induced component, and because tidal variations are dominant in measurements of stage, currents, and salinity. The discharge of the Sacramento-San Joaquin Delta into Suisun Bay is approximately 90 percent of the freshwater inflow to San Francisco Bay. Annual delta discharge is characterized by a winter season of high runoff and a summer season of low runoff. For the period 1956 to 1985 the mean of monthly discharges exceeded 1,000 cubic meters per second (35,000 cubic feet per second) for the months of December through April, whereas for July through October, it was less than 400 cubic meters per second (14,000 cubic feet per second). The months of November, May, and June commonly were transition months between these seasons. Large year-to-year deviations from this annual pattern have occurred frequently. Much less is known about the ocean-bay exchange process. Net exchanges depend on net seaward flow in the bay, tidal amplitude, and longshore coastal currents, but exchanges have not yet been measured successfully. Source-water variations are ignored by limiting discussion of mixing to salinity. The bay is composed of a northern reach, which is strongly influenced by delta discharge, and South Bay, a tributary estuary which responds to conditions in Central Bay. In the northern reach net circulation is characterized by the river-induced seaward, flow and a resulting gravitational circulation in the channels, and by a tide- and wind-induced net horizontal circulation. A surface layer of relatively fresh water in Central Bay generated by high delta discharges can induce gravitational circulation in South Bay. During low delta discharges South Bay has nearly the same salinity as Central Bay and is characterized by tide- and wind-induced net horizontal circulation. Several factors control the patterns of circulation and mixing in San Francisco Bay. Viewing circulation and mixing over different time-periods and at different geographic scales causes the influences of different factors to be emphasized. The exchange between the bay and coastal ocean and freshwater inflows determine the year-to-year behavior of San Francisco Bay as a freshwater-saltwater mixing zone. Within the bay, exchanges between the embayments control variations over a season. Circulation and mixing patterns within the embayments and the magnitude of river-induced seaward flow influence the between-bay exchanges. The within-bay patterns are in turn determined by tides, winds, and freshwater inflows. Because freshwater inflow is the only factor that can be managed, a major study focus is estimation of inflow-related effects. Most questions relate to the patterns of freshwater inflow necessary to protect valuable resources whose welfare is dependent on conditions in the bay. Among the important questions being addressed are: --What quantity of freshwater inflow is necessary to prevent salt intrusion into the Sacramento-San Joaquin Delta, and what salinity distributions in the bay would result from various inflow patterns? --What quantity of freshwater inflow is sufficient to flush pollutants through the bay?

Two Sided
No
Pieces
1
Languages
English
Related Items
GROUNDWATER BIG LOST RIVER BASIN, ID
Groundwater Budgets for the Big Lost River Basin, South-Central Idaho, 2000–19 <p> Scientific Investigations Report 2021-5078-C <p> Prepared in cooperation with the Idaho Department of Water Resources <p> By: Alexis Clark <p> Edited by: Lauren M. Zinsser <p> https://doi.org/10.3133/sir20215078C <p> <p> First posted November 9, 2022 <p> For additional information, contact: <p> Director , Idaho Water Science Center <p> https://www.usgs.gov/centers/idaho-water-science-center <p> U.S. Geological Survey <p> 230 Collins Road <p> Boise, Idaho 83702-4520 <p> <p> Abstract <p> <p> The Big Lost River Basin, located in parts of Butte and Custer Counties in south-central Idaho, supports the communities surrounding the cities of Arco, Leslie, Mackay, and Moore and provides for agricultural resources that depend on a sustainable supply of surface water from the Big Lost River and its tributaries and groundwater from an unconfined aquifer. The aquifer, situated in a structurally controlled intermontane valley, is composed of unconsolidated alluvium, consolidated sedimentary and volcanic rocks, and younger interbedded volcanic rocks. <p> <p> This report presents two separate groundwater budgets for the aquifer, one above and one below Mackay Dam, as well as a combined groundwater budget for the aquifer within the entire Big Lost River Basin. The budgets span a 20-year period (2000–19), characterizing average conditions, a dry year (2014), and a wet year (2017). The groundwater budgets will help address questions regarding the availability of groundwater supply in the Big Lost River Basin and inform future groundwater modeling. The Idaho Geological Survey has prepared the groundwater budgets as part of a larger hydrogeologic investigation completed by the U.S. Geological Survey and the Idaho Geological Survey in cooperation with the Idaho Department of Water Resources during 2018–21. Other reports describe the hydrogeologic framework and several streamflow-measurement events to evaluate gains and losses on the Big Lost River. Collectively, these reports provide an updated characterization of groundwater resources in the Big Lost River Basin which will help address water resources challenges. <p> <p> A groundwater budget is a conceptual and numerical accounting of inflow (recharge) to groundwater and outflow (discharge) from groundwater. The predominant sources of recharge to the aquifer include losing river reaches (33 percent), areal recharge (as precipitation less evapotranspiration and surface runoff, comprising about 23 percent of the total inflow), tributary canyon underflow from higher altitudes (20 percent), canal seepage (13 percent), recharge through applied irrigation on fields below the root zone and other minor sources (11 percent), and Mackay Reservoir seepage (less than 1 percent). The primary sources of discharge from the aquifer are groundwater pumpage to meet irrigation demand, domestic supply, and municipal supply (76 percent) and gaining river reaches (24 percent). <p> <p> The positive or negative difference between the sum of all inflows and outflows is regarded as the residual, representing the change in groundwater storage, groundwater outflow from the basin or subbasins, and uncertainty and errors in the budget. In the Big Lost River Basin, groundwater outflow is at the mouth of the basin below Arco into the eastern Snake River Plain aquifer. <p> <p> The total mean annual estimated recharge to the Big Lost River Basin was 439,100 acre-feet per year (acre-ft/yr; 607 cubic feet per second [ft3/s]) for 2000–19, 373,900 acre-ft/yr (516 ft3/s) in 2014, and 762 ,100 acre-ft/yr (1,053 ft3/s) in 2017. The mean annual estimated groundwater discharge from the aquifer was about 112,300 acre-ft/yr (155 ft3/s) for 2000–19, 153,500 acre-ft/yr (212 ft3/s) in 2014, and 53,400 acre-ft/yr (74 ft3/s) in 2017. The estimated mean annual groundwater residual was 326,800 acre-ft/yr (451 ft3/s) for 2000–19, 220,400 acre-ft/yr (304 ft3/s) in 2014, and 708,700 acre-ft/yr (979 ft3/s) in 2017. The mean annual residual above Mackay Dam was 100,400 acre-ft/yr (2000-19), 96,700 acre-ft (2014), and 248,300 acre-ft (2017). The mean annual residual contribution below Mackay Dam, minus any groundwater-flow above Mackay Dam, was 226,400 acre-ft/yr (2000-19), 123 ,700 acre-ft (2014), and 460,400 acre-ft (2017). <p> <p> These results are highly sensitive to assumptions about certain budget inflow parameters. In particular, the magnitude of the budget residuals during especially dry and wet periods is amplified by the groundwater-budget terms tributary streamflow and tributary underflow that contribute appreciable recharge but also have high uncertainty. <p> <p> The results of the groundwater-budget evaluation describe an interconnected and complex hydrologic response throughout the basin to various climatic and water-use trends. The part of the basin above Mackay Dam typically has a positive groundwater residual derived from snowmelt recharge to tributary canyons and areal recharge in excess of groundwater pumpage for irrigation demand. This supply is used to meet irrigation demand above Mackay Dam and to provide for water supply below Mackay Dam. On average, groundwater inflow from above Mackay Dam to below Mackay Dam, assuming negligible reservoir storage effects, accounts for about 25 percent of the total groundwater recharge below Mackay Dam. Considerable recharge to groundwater below Mackay Dam occurs through seepage from the Big Lost River and canals and ditches. Most groundwater discharge from the aquifer is through irrigation pumping. The water supply below Mackay Dam is highly dependent on available upstream surface-water flows, the magnitude of the groundwater residual from above Mackay Dam, and annual variability in local groundwater conditions. <p>
TRIGONOMETRIC LEVELING IN THE USGS
Procedures and best practices for trigonometric leveling in the U.S. Geological Survey <p> <p> First posted December 23, 2020 <p> For additional information, contact: <p> Director, New York Water Science Center U.S. Geological Survey 425 Jordan Road Troy, NY 12180–8349 <p> <p> Abstract <p> <p> With the advent of highly precise total stations and modern surveying instrumentation, trigonometric leveling has become a compelling alternative to conventional leveling methods for establishing vertical-control networks and for perpetuating a datum to field sites. Previous studies of trigonometric-leveling measurement uncertainty proclaim that first-, second-, and third-order accuracies may be achieved if strict leveling protocols are rigorously observed. Common field techniques to obtain quality results include averaging zenith angles and slope distances observed in direct and reverse instrument orientation (F1 and F2, respectively), multiple sets of reciprocal observations, quality meteorological observations to correct for the effects of atmospheric refraction, and electronic distance measurements that generally do not exceed 500 feet. In general, third-order specifications are required for differences between F1 and F2 zenith angles and slope distances; differences between redundant instrument-height measurements; section misclosure determined from reciprocal observations; and closure error for closed traverse. For F1 observations such as backsight check and check shots, the construction-grade specification is required for elevation differences between known and observed values. <p> <p> Recommended specifications for trigonometric-leveling equipment include a total station instrument with an angular uncertainty specification less than or equal to plus or minus 5 arc-seconds equipped with an integrated electronic distance measurement device with an uncertainty specification of less than or equal to plus or minus 3 millimeters plus 3 parts per million. A paired data collector or integrated microprocessor should have the capability to average multiple sets of measurements in direct and reverse instrument orientation. Redundant and independent measurements by the survey crew and automated or manual reduction of slant heights to the vertical equivalent are recommended to obtain quality instrument heights. Horizontal and vertical collimation tests should be conducted daily during trigonometric-leveling surveys, and electronic distance-measurement instruments should be tested annually on calibrated baselines maintained by the National Geodetic Survey. Specifications that were developed by the National Geodetic Survey for geodetic leveling have been adapted by the U.S. Geological Survey (USGS) for the purpose of developing standards for trigonometric leveling, which are identified as USGS Trigonometric Level I (TL I), USGS Trigonometric Level II (TL II), USGS Trigonometric Level III (TL III), and USGS Trigonometric Level IV (TL IV). TL I, TL II, and TL III surveys have a combination of first, second, and third geodetic leveling specifications that have been modified for plane leveling. The TL III category also has specifications that are adapted from construction-grade standards, which are not recognized by the National Geodetic Survey for geodetic leveling. A TL IV survey represents a leveling approach that does not generally meet criteria of a TL I, TL II, or TL III survey. <p> <p> Site conditions, such as highly variable topography, and the need for cost-effective, rapid, and accurate data collection in response to coastal or inland flooding have emphasized the need for an alternative approach to conventional leveling methods. Trigonometric leveling and the quality-assurance methods described in this manual will accommodate most site and environmental conditions, but measurement uncertainty is potentially variable and dependent on the survey method. Two types of closed traverse surveys have been identified as reliable methods to establish and perpetuate vertical control: the single-run loop traverse and double-run spur traverse. Leveling measurements for a double-run spur traverse are made in the forward direction from the origin to the destination and are then retraced along the same leveling route in the backward direction, from the destination to the origin. Every control point in a double-run spur traverse is occupied twice. Leveling measurements for a single-run loop traverse are made in the forward direction from the origin point to the destination, and then from the destination to the origin point, along a different leveling route. The only point that is redundantly occupied for the single-run loop traverse is the origin. An open traverse method is also considered an acceptable approach to establish and perpetuate vertical control if the foresight prism height is changed between measurement sets to ensure at least two independent observations. A modified version of leap-frog leveling is recommended for all traverse surveys because it reduces measurement uncertainty by forcing the surveying instrumentation into a level and centered condition over the ground point as the instrumentation is advanced to the objective. Sideshots are considered any radial measurement made from the total station that is not part of a traverse survey. F1 and F2 observations are recommended for sideshots measurements for projects that require precise elevations. Quality-assurance measurements made in F1 from the station to network-control points should be considered for surveys that require a high quantity of sideshots. <p> <p> The accuracy of a trigonometric-leveling survey essentially depends on four components (1) the skill and experience of the surveyor, (2) the environmental or site conditions, (3) the surveying method, and (4) the quality of the surveying instrumentation. Although components one and two can sometimes be difficult to evaluate and be highly variable, the objective of this manual is to disseminate information needed to identify, maintain, and operate quality land-surveying instrumentation, and to document procedures and best practices for preparing and executing precision trigonometric-leveling surveys in the USGS. <p>
STREAMS OF FAIRFAX COUNTY, VA
Evaluating Drivers of Hydrology, Water Quality, and Benthic Macroinvertebrates in Streams of Fairfax County, Virginia, 2007–18 <p> <p> Scientific Investigations Report 2023-5027 <p> <p> Prepared in cooperation with Fairfax County, Virginia <p> By: James S. Webber, Jeffrey G. Chanat, Aaron J. Porter, and John D. Jastram <p> <p> https://doi.org/10.3133/sir20235027 <p> <p> First posted May 18, 2023 <p> For additional information, contact: <p> Director, Virginia and West Virginia Water Science Center <p> https://www.usgs.gov/centers/virginia-and-west-virginia-water-science-ce nter <p> U.S. Geological Survey <p> 1730 East Parham Road <p> Richmond, VA 23228 <p> <p> Abstract <p> <p> In 2007, the U.S. Geological Survey partnered with Fairfax County, Virginia, to establish a long-term water-resources monitoring program to evaluate the hydrology, water quality, and ecology of Fairfax County streams and the watershed-scale effects of management practices. Fairfax County uses a variety of management practices, policies, and programs to protect and restore its water resources, but the effects of such strategies are not well understood. This report used streamflow, water-quality, and ecological monitoring data collected from 20 Fairfax County watersheds from 2007 through 2018 to assess the effects of management practices, landscape factors, and climatic conditions on observed nutrient, sediment, salinity, and benthic-macroinvertebrate community responses. <p> <p> Urbanization, climatic variability, and an increase in management practices occurred within Fairfax County during the study period. Impervious cover, housing units, wastewater infrastructure, and (or) stormwater infrastructure increased in most study watersheds. Climatic conditions varied among study years; countywide estimates of average-annual air temperature differed by about 3 degrees Celsius, and total precipitation ranged from about 34 to 63 inches per year. The effects of the management practices, implemented to reduce nitrogen, phosphorus, and (or) sediment loads, are considered in this study. These management practices primarily consist of stormwater retrofits and stream restorations; however, stream restorations account for most of the financial investment and expected load reductions. Management practices were implemented in half of the study watersheds, and most practices were installed and reductions credited late in the study period. <p> <p> Changes in hydrologic response during storm events were evaluated over the study period because many management practices that were implemented were designed to achieve nutrient and sediment reductions by slowing or intercepting runoff. The average number and length of storm events was mostly unchanged throughout the monitoring network. Four watersheds with 10 years of streamflow data showed a mixture of trends in stormflow peak, volume, and rate-of-change. Event-mean nutrient and sediment concentrations from these watersheds were evaluated during storm events and generally showed increases in total phosphorus (TP) and suspended sediment and reductions or no changes in total nitrogen (TN). <p> <p> Landscape inputs of nitrogen and phosphorus and the percentage of inputs delivered to streams were estimated for the study watersheds. Estimated phosphorus from fertilizer and nitrogen from atmospheric deposition represented large nutrient inputs in most watersheds; amounts of other nonpoint sources varied based on land use. Estimated nitrogen inputs declined throughout Fairfax County and in most study watersheds from 2008 through 2018; in comparison, phosphorus input changes were relatively small. Most nonpoint-nutrient inputs were retained on the landscape and did not reach streams, with slightly more nitrogen retention than phosphorus, on average. Retention rates were lower for years with more precipitation and streamflow. After adjusting for streamflow, TN and TP loads were generally higher for years with more nutrient inputs. Calculated as a function of flow-adjusted loads, TP retention declined at most stations from 2009 through 2018, in comparison, TN retention was relatively unchanged. Landscape and climatic conditions affected spatial differences and changes in Fairfax County stream conditions from 2009 through 2018. TN concentrations were higher and increases over time were larger in watersheds with elevated septic-system density. TP concentrations were higher in watersheds with more turfgrass; concentrations were lower, but had larger increases over time, in watersheds with deeper soils. Suspended-sediment concentrations were higher in watersheds with greater stream densities. Specific conductance was higher in watersheds with more developed land use and shallower soils. Benthic-macroinvertebrate index of biotic integrity (IBI) scores were lower in watersheds with high road density and had larger increases over time in bigger, more developed watersheds. Annual variability in TN and TP concentrations and benthic-macroinvertebrate IBI scores was affected by precipitation; annual variability in suspended sediment concentrations and specific conductance was affected by air temperature. <p> <p> After accounting for influences from landscape and climatic conditions, expected management-practice effects were not consistently observed in monitored stream responses. These effects were assessed by comparing expected management-practice load reductions with the timing, direction, and magnitude of changes in storm-event hydrology, nutrient and sediment loads, median-annual water-quality conditions, and benthic-macroinvertebrate IBI scores. An important consideration for future investigations of management-practice effects is how to control for water-quality and ecological variability caused by geologic properties, the urban environment, precipitation, and (or) air temperature. The interpretation of management-practice effects in this report was likely influenced by a combination of factors, including (1) the amount, timing, and location of management-practice implementation; (2) unmeasured landscape and climatic factors; (3) uncertain management-practice expectations; (4) hydrologic variability; and (5) analytical assumptions. Through continued data-collection efforts, particularly after management practices have been completed, many of these factors may become less influential in the future. <p>