Product

TRIGONOMETRIC LEVELING IN THE USGS

$16.00
Available

Product Details

Product Number
534065
Series
TM-11-D03
Scale
NO SCALE
Alternate ID
TM-11-D03
ISBN
978-1-4113-4443-3
Authors
MICHAEL L NOLL
Version Date
01/01/2020
Countries
USA
Media
Paper
Format
Bound

Additional Details

Description
Procedures and best practices for trigonometric leveling in the U.S. Geological Survey

First posted December 23, 2020

For additional information, contact:

Director, New York Water Science Center U.S. Geological Survey 425 Jordan Road Troy, NY 12180–8349

Abstract

With the advent of highly precise total stations and modern surveying instrumentation, trigonometric leveling has become a compelling alternative to conventional leveling methods for establishing vertical-control networks and for perpetuating a datum to field sites. Previous studies of trigonometric-leveling measurement uncertainty proclaim that first-, second-, and third-order accuracies may be achieved if strict leveling protocols are rigorously observed. Common field techniques to obtain quality results include averaging zenith angles and slope distances observed in direct and reverse instrument orientation (F1 and F2, respectively), multiple sets of reciprocal observations, quality meteorological observations to correct for the effects of atmospheric refraction, and electronic distance measurements that generally do not exceed 500 feet. In general, third-order specifications are required for differences between F1 and F2 zenith angles and slope distances; differences between redundant instrument-height measurements; section misclosure determined from reciprocal observations; and closure error for closed traverse. For F1 observations such as backsight check and check shots, the construction-grade specification is required for elevation differences between known and observed values.

Recommended specifications for trigonometric-leveling equipment include a total station instrument with an angular uncertainty specification less than or equal to plus or minus 5 arc-seconds equipped with an integrated electronic distance measurement device with an uncertainty specification of less than or equal to plus or minus 3 millimeters plus 3 parts per million. A paired data collector or integrated microprocessor should have the capability to average multiple sets of measurements in direct and reverse instrument orientation. Redundant and independent measurements by the survey crew and automated or manual reduction of slant heights to the vertical equivalent are recommended to obtain quality instrument heights. Horizontal and vertical collimation tests should be conducted daily during trigonometric-leveling surveys, and electronic distance-measurement instruments should be tested annually on calibrated baselines maintained by the National Geodetic Survey. Specifications that were developed by the National Geodetic Survey for geodetic leveling have been adapted by the U.S. Geological Survey (USGS) for the purpose of developing standards for trigonometric leveling, which are identified as USGS Trigonometric Level I (TL I), USGS Trigonometric Level II (TL II), USGS Trigonometric Level III (TL III), and USGS Trigonometric Level IV (TL IV). TL I, TL II, and TL III surveys have a combination of first, second, and third geodetic leveling specifications that have been modified for plane leveling. The TL III category also has specifications that are adapted from construction-grade standards, which are not recognized by the National Geodetic Survey for geodetic leveling. A TL IV survey represents a leveling approach that does not generally meet criteria of a TL I, TL II, or TL III survey.

Site conditions, such as highly variable topography, and the need for cost-effective, rapid, and accurate data collection in response to coastal or inland flooding have emphasized the need for an alternative approach to conventional leveling methods. Trigonometric leveling and the quality-assurance methods described in this manual will accommodate most site and environmental conditions, but measurement uncertainty is potentially variable and dependent on the survey method. Two types of closed traverse surveys have been identified as reliable methods to establish and perpetuate vertical control: the single-run loop traverse and double-run spur traverse. Leveling measurements for a double-run spur traverse are made in the forward direction from the origin to the destination and are then retraced along the same leveling route in the backward direction, from the destination to the origin. Every control point in a double-run spur traverse is occupied twice. Leveling measurements for a single-run loop traverse are made in the forward direction from the origin point to the destination, and then from the destination to the origin point, along a different leveling route. The only point that is redundantly occupied for the single-run loop traverse is the origin. An open traverse method is also considered an acceptable approach to establish and perpetuate vertical control if the foresight prism height is changed between measurement sets to ensure at least two independent observations. A modified version of leap-frog leveling is recommended for all traverse surveys because it reduces measurement uncertainty by forcing the surveying instrumentation into a level and centered condition over the ground point as the instrumentation is advanced to the objective. Sideshots are considered any radial measurement made from the total station that is not part of a traverse survey. F1 and F2 observations are recommended for sideshots measurements for projects that require precise elevations. Quality-assurance measurements made in F1 from the station to network-control points should be considered for surveys that require a high quantity of sideshots.

The accuracy of a trigonometric-leveling survey essentially depends on four components (1) the skill and experience of the surveyor, (2) the environmental or site conditions, (3) the surveying method, and (4) the quality of the surveying instrumentation. Although components one and two can sometimes be difficult to evaluate and be highly variable, the objective of this manual is to disseminate information needed to identify, maintain, and operate quality land-surveying instrumentation, and to document procedures and best practices for preparing and executing precision trigonometric-leveling surveys in the USGS.

Survey Date
2020
Print Date
2020
Height In Inches
11.000
Length In Inches
8.500
Two Sided
Yes
Pieces
1
Related Items
IDENTIFYING AND PRESERVING HIGH WATER MA
Identifying and preserving high-water mark data <p> <p> Techniques and Methods 3-A24 <p> <p> By: Todd A. Koenig, Jennifer L. Bruce, Jim O'Connor, Benton D. McGee, Robert R. Holmes Jr., Ryan Hollins, Brandon T. Forbes, Michael S. Kohn, Mathew Schellekens, Zachary W. Martin, and Marie C. Peppler <p> <p> https://doi.org/10.3133/tm3A24 <p> <p> First posted March 8, 2016 <p> For additional information, contact: Chief, Office of Surface Water <p> U.S. Geological Survey <p> 415 National Center <p> 12201 Sunrise Valley Drive <p> Reston, VA 20192 <p> http://water.usgs.gov/osw/ <p> <p> Abstract <p> <p> High-water marks provide valuable data for understanding recent and historical flood events. The proper collection and recording of high-water mark data from perishable and preserved evidence informs flood assessments, research, and water resource management. Given the high cost of flooding in developed areas, experienced hydrographers, using the best available techniques, can contribute high-quality data toward efforts such as public education of flood risk, flood inundation mapping, flood frequency computations, indirect streamflow measurement, and hazard assessments. <p> <p> This manual presents guidance for skilled high-water mark identification, including marks left behind in natural and man-made environments by tranquil and rapid flowing water. This manual also presents pitfalls and challenges associated with various types of flood evidence that help hydrographers identify the best high-water marks and assess the uncertainty associated with a given mark. Proficient high-water mark data collection contributes to better understanding of the flooding process and reduces risk through greater ability to estimate flood probability. <p> <p> The U.S. Geological Survey, operating the Nation’s premier water data collection network, encourages readers of this manual to familiarize themselves with the art and science of high-water mark collection. The U.S. Geological survey maintains a national database at http://water.usgs.gov/floods/FEV/ that includes high-water mark information for many flood events, and local U.S. Geological Survey Water Science Centers can provide information to interested readers about participation in data collection and flood documentation efforts as volunteers or observers. <p>
WESTERN WET GAS PART OF THE MARCELLUS
Groundwater Quality and Geochemistry of the Western Wet Gas Part of the Marcellus Shale Oil and Gas Play in West Virginia <p> <p> First posted December 16, 2022 <p> For additional information, contact: <p> Director, Virginia and West Virginia Water Science Center <p> https://www.usgs.gov/centers/va-wv-water <p> U.S. Geological Survey <p> 1730 East Parham Road <p> Richmond, Virginia 23228 <p> <p> Abstract <p> <p> Thirty rural residential water wells in the wet gas region of the Marcellus Shale oil and gas play in northwestern West Virginia were sampled by the U.S. Geological Survey (USGS) in 2018, in cooperation with West Virginia State agencies, to analyze for a range of water-quality constituents, including major ions, trace metals, radionuclides, bacteria, and methane and other dissolved hydrocarbon gases. The groundwater-quality data collected for this study were used to assess the overall quality of groundwater in the study area in relation to public drinking-water standards. The groundwater-quality data were also evaluated with respect to geology, well depth, topographic setting, and proximity to oil and gas wells to identify possible relations to these factors. <p> <p> The presence of total coliform bacteria in groundwater is a potential indicator of surface contamination. The presence of Escherichia coli bacteria is indicative of fecal contamination of groundwater from either human or animal sources and may be considered an indicator of other related pathogens such as viruses. Total coliforms were detected in 26 of the 30 (87 percent) wells sampled. Eleven of the 30 (37 percent) wells sampled had detections of Escherichia coli bacteria. <p> <p> Sodium concentrations in 24 of 30 (80 percent) samples exceeded the U.S. Environmental Protection Agency (EPA) 20-milligram per Liter (mg/L) health-based value (HBV). Manganese, aluminum, and iron concentrations exceeded the EPA 50, 2.0, and 300 micrograms per liter (µg/L) secondary maximum contaminant level (SMCL) drinking-water standards at 14 (47 percent), 7 (23 percent), and 5 (17 percent) of the 30 wells sampled. Two of the 30 (7 percent) wells sampled had concentrations of manganese that exceeded the 300-µg/L USGS health-based screening level (HBSL). Arsenic concentrations at 7 of 30 (23 percent) wells sampled exceeded the 10-µg/L EPA maximum contaminant level (MCL) health-based drinking water standard. The EPA maximum contaminant level goal (MCLG) for arsenic is 0 µg/L and 29 of 30 wells sampled contained detectable concentrations of arsenic. <p> <p> None of the 30 wells sampled exceeded the U.S. Office of Surface Mining Reclamation and Enforcement (OSMRE) 28-mg/L immediate action level (IAL) for methane in groundwater and only 1 of 30 (3 percent) sites exceeded the 10-mg/L OSMRE level of concern (LOC) for methane in groundwater. Of the 28 wells sampled for radon-222 all 28 (100 percent) exceeded the EPA proposed 300-picocuries per liter (pCi/L) MCL for radon. None of the samples exceeded the 4,000-pCi/L alternate maximum contaminant level (AMCL) which is applicable to public drinking water systems that have adopted radon mitigation programs. <p> <p> Wilcoxon Signed Rank Tests indicated statistically significant differences at a 95 percent confidence interval (p less than 0.05) in radium-226, barium, and ethane groundwater concentrations with respect to the density of oil and gas wells present within a 500-meter (m) radius around the rural residential wells sampled for the study. Samples from residential wells that had four or fewer oil and gas wells in the surrounding 500-m radius had statistically lower concentrations of radium-226, bromide, and ethane than samples from residential wells sampled that had five or more oil and gas wells in the surrounding 500-m radius. Given the available data, the relationship between concentrations of radium-226, bromide, and ethane for wells sampled in this study and oil and gas development or natural geochemical processes is not clear. <p> <p> Groundwater-age tracers (chlorofluorocarbons, tritium, and sulfur hexafluoride) were sampled at 17 of the 30 wells. All 17 samples contained a fraction of young, post-1950s groundwater. Many of the groundwater samples collected for this study have high calcium to sodium ratios and low total dissolved solids concentrations, indicating they are dominated by recently recharged water. A subset of samples had chloride to bromide mass ratios between 70 and 200, indicating that deep Appalachian basin brines mixed with the shallow groundwater. For most of the samples in this study, the C1 through C6 hydrocarbons have characteristics that reflect a biogenic gas signature that has, to varying degrees, undergone oxidation processes during transport. None of the samples show a characteristic thermogenic cracking pattern among the hydrocarbon ratios. <p>
THE USGS NATIONAL WATER DASHBOARD
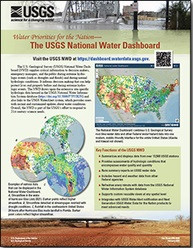
<p> Water Priorities for the Nation—The USGS National Water Dashboard <p> </p> <font color=red><i> <p> This product is not available for order, it can only be downloaded from here (click on image) or within the Publications Warehouse at https://pubs.er.usgs.gov/publication/fs20223003 </p> </i> </font> <p> <p> First posted March 2, 2022 <p> For additional information, contact: Associate Director, Water Resources Mission Area https://www.usgs.gov/mission-areas/water-resources U.S. Geological Survey 12201 Sunrise Valley Drive Reston, VA 20192 <p> <p> Abstract <p> <p> The U.S. Geological Survey National Water Dashboard supplies critical information to decision makers, emergency managers, and the public during extreme hydrologic events (such as droughts and floods) and during normal hydrologic conditions. It informs decision making that can help protect lives and property before and during extreme hydrologic events. The National Water Dashboard draws upon the extensive site-specific hydrologic data housed in the U.S. Geological Survey National Water Information System database (https://doi.org/10.5066/F7P55KJN) and also links to the U.S. Geologic Survey WaterAlert system, which provides users with instant and customized updates about water conditions. Overall, the National Water Dashboard is part of the U.S. Geological Survey's effort to respond to 21st century science needs. <p>