Product

VOLCANO AND EARTHQUAKE MONITORING PLAN

$16.00
Available

Product Details

Product Number
534173
Series
SIR-2022-5032
Scale
NO SCALE
Alternate ID
SIR2022-5032
Authors
IDAHO GEOLOGICAL SURVEY
Version Date
01/01/2022
Countries
USA
Media
Paper
Format
Bound

Additional Details

Description

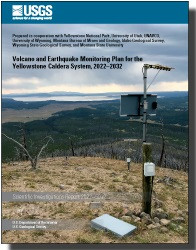
Volcano and Earthquake Monitoring Plan for the Yellowstone Caldera System, 2022–2032

First posted June 21, 2022

For additional information, contact:

Director,

Yellowstone Volcano Observatory

https://www.usgs.gov/observatories/yvo

U.S. Geological Survey

345 Middlefield Road, MS 910

Menlo Park, CA 94025

Executive Summary

The Yellowstone Volcano Observatory (YVO) is a consortium of nine Federal, State, and academic agencies that: (1) provides timely monitoring and hazards assessment of volcanic, hydrothermal, and earthquake activity in and around Yellowstone National Park, and (2) conducts research to develop new approaches to volcano monitoring and better understand volcanic activity in the Yellowstone region and elsewhere. The U.S. Geological Survey (USGS) arm of YVO is also responsible for monitoring and reporting on volcanic activity in the Intermountain West of the United States.

The previous YVO monitoring plan for the Yellowstone region spanned 2006–2015 and focused on strengthening the region-wide coverage, or backbone, of monitoring systems (Yellowstone Volcano Observatory, 2006). The goals of that plan have largely been achieved thanks to significant investments in instrumentation and infrastructure, especially by the National Science Foundation EarthScope Plate Boundary Observatory (now known as the Network Of The Americas, or NOTA) and the American Reinvestment and Recovery Act. This revision of the monitoring plan, covering 2022–2032, builds upon these improvements to monitoring systems in the Yellowstone region while also accounting for new insights into the dynamics of the area’s seismic, volcanic, and hydrothermal activity. These additional improvements are designed to fill gaps in the monitoring network and to better understand and track hazards associated with hydrothermal processes. These improvements include:

Conversion of remaining analog seismic stations to digital,

Addition of Global Positioning System (GPS) stations in the vicinity of Norris Geyser Basin and other areas where changes in deformation rate and style have been observed,

Implementation of continuous gas monitoring in several areas of Yellowstone National Park, and

Improvements to lake, meteorological, and hydrological monitoring to better track hydrothermal activity, including that occurring on lake bottoms, and to aid in understanding of whether such activity might be influenced by external forces, like environmental conditions.

The 2022–2032 monitoring plan for the Yellowstone volcanic system also proposes to improve monitoring of hydrothermal areas to better understand these dynamic systems and their associated hazards. To date, only a single seismometer has been placed within one of Yellowstone National Park’s geyser basins because seismic noise associated with boiling water can hinder interpretation of overall seismic and magmatic activity, but this concern has been mitigated by improvements to backbone monitoring. Deployment of geophysical, geochemical, hydrological, and geological monitoring instruments in geyser basins will be accompanied by campaigns to measure gas and water chemistry and flux, as well as aerial and satellite surveys of gas and thermal emissions.

Close collaboration between YVO member institutions and other research agencies is needed to achieve these monitoring goals and to use the derived data to advance understanding of how Yellowstone Caldera and similar volcanic systems work. At the same time, attention must be paid to minimize the impact of monitoring efforts and infrastructure on the environment. YVO thus commits to serving as stewards of the natural, cultural, and historical resources in and around Yellowstone National Park while maximizing scientific gain for the betterment of society.

Survey Date
2022
Print Date
2022
Height In Inches
11.000
Length In Inches
8.500
Two Sided
Yes
Pieces
1
Languages
English
Related Items
VOLCANO HAZARDS PROGRAM, FOR 2022-2026
The Volcano Hazards Program: <p> <p> Strategic Science Plan for 2022 - 2026 <p> <p> Introduction <p> <p> The U.S. Geological Survey (USGS) Volcano Hazards Program (VHP) Strategic Science Plan identifies concrete and realistic goals that advance the VHP’s scientific and operational mission, prioritizes them according to their immediate importance and likelihood of success, and recommends how the VHP can best achieve them, either independently or in collaboration with academic, government, and other partners. The plan addresses goals that share three distinguishing characteristics: innovation, importance, and feasibility over a five-year time scale. Although not stressed here, the important day-to-day operations, which have made the VHP (also referred to as “program”) so successful and effective since its inception, will continue. The new and innovative work proposed below supplements—rather than supplants—the VHP’s existing efforts, which remain essential for fulfilling its primary mission. Pursuing the following major strategic goals will enhance program operations over the next five years: <p>
ASSESSMENT & MITIGATION VOLCANIC HAZARDS
Optimizing Satellite Resources for the Global Assessment and Mitigation of Volcanic Hazards—Suggestions from the USGS Powell Center Volcano Remote Sensing Working Group <p> <p> Scientific Investigations Report 2022-5116 <p> <p> By: M. E. Pritchard, M. Poland, K. Reath, B. Andrews, M. Bagnardi, J. Biggs, S. Carn, D. Coppola, S.K. Ebmeier, M.A. Furtney, T. Girona, J. Griswold, T. Lopez, P. Lundgren, S. Ogburn, M. Pavolonis, E. Rumpf, G. Vaughan, C. Wauthier, R. Wessels, R. Wright, K.R. Anderson, M.G. Bato, and A. Roman <p> <p> For additional information, contact: <p> Director, Volcano Science Center <p> https://www.usgs.gov/centers/volcano-science-center <p> U.S. Geological Survey <p> 1300 SE Cardinal Court <p> Vancouver, WA 38683 <p> Abstract <p> <p> A significant number of the world’s approximately 1,400 subaerial volcanoes with Holocene eruptions are unmonitored by ground-based sensors yet constitute a potential hazard to nearby residents and infrastructure, as well as air travel and global commerce. Data from an international constellation of more than 60 current satellite instruments provide a cost-effective means of tracking activity and potentially forecasting hazards at volcanoes around the world. These data span the electromagnetic spectrum: ultraviolet, optical, infrared, and microwave (synthetic aperture radar). They can measure volcanic thermal and gas emissions, ground displacement, and surface and topographic change, providing information that addresses one of the grand challenges in volcanology—to overcome our incomplete understanding of the relation between volcanic unrest and eruption, which is currently based on only a few well-studied volcanoes. <p> <p> Although the potential of volcano remote sensing has been recognized for decades, there are many hurdles to clear before remote sensing data can be used fully by all volcano observatories. These include: (1) the limited temporal and spatial coverage of active volcanoes by satellites and the delayed distribution of those data; (2) the lack of background d ata acquired at all volcanoes; and (3) limited access to, and utilization of, remote sensing data in some areas owing to a lack of expertise, licensing, user-friendly formats, data access portals, or computational infrastructure. <p> <p> While remote sensing data will never replace ground-based monitoring, a joint observation strategy provides a powerful means of assessing volcanic activity before, during, and after hazardous eruptions, especially given the unique spatial, temporal, and spectral perspective provided by remote measurements. A coordinated international remote sensing observation strategy for volcanoes—similar to one used by the cryosphere community—along with a volcano space task group to maximize the utility of satellite data for volcano monitoring would be highly beneficial. Such a vision could facilitate (1) global coordination of satellite observations (as done for polar regions) for background monitoring and eruption response, (2) open data that can be rapidly distributed during crises, (3) communication tools and forums for discussion of satellite data, (4) integrated ground and satellite databases of unrest, and (5) global capacity building. <p>
STORMWATER QUANTITY AND QUALITY, VA
Stormwater Quantity and Quality in Selected Urban Watersheds in Hampton Roads, Virginia, 2016–2020 <p> <p> Prepared in cooperation with the Hampton Roads Planning District Commission <p> <p> First posted November 23, 2022 <p> For additional information, contact: <p> Director, Virginia and West Virginia Water Science Center <p> https://www.usgs.gov/centers/virginia-and-west-virginia-water-science-ce nter <p> U.S. Geological Survey <p> 1730 East Parham Road <p> Richmond, Virginia 23228 <p> <p> Abstract <p> <p> Urbanization can substantially alter sediment and nutrient loadings to streams. Although a growing body of literature has documented these processes, conditions may vary widely by region and physiographic province (PP). Substantial investments are made by localities to meet federal, state, and local water-quality goals and locally relevant monitoring data are needed to appropriately set standards and track progress. In 2016, a long-term stormwater monitoring program was initiated to characterize water-quality and streamflow conditions and compute average annual nutrient- and sediment-loading rates across the three dominant land-use types—commercial (COM), high-density residential, and single-family residential (SFR)—in the Hampton Roads metropolitan region within the Coastal Plain PP in southeastern Virginia. This report summarizes the first five years of data collection to (1) assess patterns in streamflow and water chemistry across the three major land-use types in the region; (2) compute annual sediment and nutrient loads; and (3) compare annual loading rates to those in other urbanized regions. <p> <p> Patterns in watershed hydrology characteristics and conditions were similar to those observed in other urban monitoring studies. Base-flow indices were lower and stream flashiness indices were higher in the study watersheds compared to those in less developed reference watersheds. These patterns reflect a decrease in infiltration and consequent increase in storm runoff as a result of urbanization. Stream flashiness was strongly positively related to degree of impervious land cover and negatively to watershed area. Hydrologic metrics varied across the land-use gradient, reflecting greater and more rapid runoff in the COM watersheds than in SFR watersheds. Event-based analyses conducted exclusively on periods of runoff highlight longer duration events, longer time-to-peak streamflow, and a longer lag between peak precipitation and peak streamflow in SFR watersheds, and higher stormflow yields, runoff ratios, and peak flows in COM watersheds. Event-based metrics varied seasonally because of regional meteorological patterns. <p> <p> Concentrations of total suspended solids (TSS) and total phosphorus (TP) were positively correlated to streamflow, whereas concentrations of total nitrogen (TN) varied little across the hydrologic regime. Phosphorus composition varied spatially and seasonally—the proportion of orthophosphate (PO43-) was highest in samples collected from stations draining residential land-use types and was elevated in summer and fall. Nitrogen composition varied with hydrologic condition: nitrate plus nitrite (NO3-) dominance during base flow shifted to total organic nitrogen (TON) dominance during periods of runoff. For all three major constituents (TSS, TP, and TN), concentrations were highest in SFR watersheds, whereas yields were greatest in COM watersheds. This seeming contradiction in concentration and yield across land-use types occurred because of spatial differences in streamflow yield. <p> <p> The network average TSS yield in Hampton Roads was lower than that in comparable networks in Fairfax County, Virginia, and Gwinnett County, Georgia, a difference that may reflect dissimilarities in the topographic and soil characteristics of the Coastal Plain versus those in Piedmont PPs, as well as differences in engineered concrete stormwater conveyances versus earthen streams. The average annual TP yield in Hampton Roads was higher than averages reported in comparison studies and was primarily driven by elevated PO43-. Elevated PO43- yields may be related to unique soil and geological features of the Coastal Plain PP that limit phosphorus retention. Total nitrogen yields in the Hampton Roads and Fairfax County networks were similar; however, composition did vary, with greater total organic nitrogen yields in Hampton Roads and greater NO3- yields in Fairfax County. <p> <p> Cross-correlation analyses and mass-volume curves were used to assess the timing of sediment and nutrient loadings. The majority of TSS and TP was typically transported during the initial phase of a storm-runoff event, a phenomenon commonly termed the “first flush.” Although TN concentrations typically peaked within an hour of peak streamflow, reflecting the particulate dominance of TN during stormflows, and loadings were greater during the early phase of most storm events, the stricter first-flush criterion was rarely met. This suggests that the most abundant sources of TN in these watersheds are not as directly connected to the stormwater-conveyance system as are TSS and TP. <p>