Product

UNGULATE MIGRATIONS OF THE WESTERN US V2

$16.00
Available

Product Details

Product Number
534069
Series
SIR-2022-5008
Scale
NO SCALE
Alternate ID
SIR-2022-5008
ISBN
978-1-4113-4438-9
Authors
STAN HARTER
Version Date
04/01/2022
Countries
USA
Media
Paper
Format
Bound

Additional Details

Description
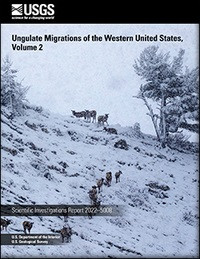
Ungulate Migrations of the Western United States, Volume 2

First posted April 7, 2022

For additional information, contact:

Associate Director, Ecosystems Mission Area U.S. Geological Survey 12201 Sunrise Valley Drive, MS 300 Reston, VA 20192

Abstract

Migration is widespread across taxonomic groups and increasingly recognized as fundamental to maintaining abundant wildlife populations and communities. Many ungulate herds migrate across the western United States to access food and avoid harsh environmental conditions. With the advent of global positioning system (GPS) collars, researchers can describe and map the year-round movements of ungulates at both large and small spatial scales. The migrations can traverse landscapes that are a mix of different jurisdictional ownership and management. Today, the landscapes migrating herds traverse are increasingly threatened by fencing, high-traffic roads, oil and gas development, and other types of permanent development. Through the use of GPS collars, a model of science-based conservation emerged in which migration corridors, stopovers, and winter ranges can be mapped in detail, thereby allowing threats and conservation opportunities to be identified and remedied. In 2018, the U.S. Geological Survey (USGS) assembled a Corridor Mapping Team (CMT) to work collaboratively with western states to map migrations of Odocoileus hemionus (mule deer), Cervus canadensis (elk), and Antilocapra americana (pronghorn). Led by the USGS Wyoming Cooperative Fish and Wildlife Research Unit, the team consists of Federal scientists, university researchers, and biologists and analysts from participating State and Tribal agencies. The first set of maps described a total of 42 migrations across 5 western states and was published in 2020 as the first volume of this report series. This second volume describes an additional 65 migrations mapped within 9 western states and select Tribal lands. As the western United States continues to grow, this report series and the associated map files released by the USGS will allow for migration maps to be used for conservation planning by a wide array of State and Federal stakeholders to reduce barriers to migration caused by fences, roads, and other development.

Print Date
2022
Height In Inches
11.000
Length In Inches
8.500
Two Sided
Yes
Pieces
1
Languages
English
Related Items
DOCUMENTATION OF METHODS AND INVENTORY
Documentation of Methods and Inventory of Irrigation Data Collected for the 2000 and 2005 U.S. Geological Survey Estimated Use of Water in the United States, Comparison of USGS-Compiled Irrigation Data to Other Sources, and Recommendations for Future Compilations
WESTERN WET GAS PART OF THE MARCELLUS
Groundwater Quality and Geochemistry of the Western Wet Gas Part of the Marcellus Shale Oil and Gas Play in West Virginia <p> <p> First posted December 16, 2022 <p> For additional information, contact: <p> Director, Virginia and West Virginia Water Science Center <p> https://www.usgs.gov/centers/va-wv-water <p> U.S. Geological Survey <p> 1730 East Parham Road <p> Richmond, Virginia 23228 <p> <p> Abstract <p> <p> Thirty rural residential water wells in the wet gas region of the Marcellus Shale oil and gas play in northwestern West Virginia were sampled by the U.S. Geological Survey (USGS) in 2018, in cooperation with West Virginia State agencies, to analyze for a range of water-quality constituents, including major ions, trace metals, radionuclides, bacteria, and methane and other dissolved hydrocarbon gases. The groundwater-quality data collected for this study were used to assess the overall quality of groundwater in the study area in relation to public drinking-water standards. The groundwater-quality data were also evaluated with respect to geology, well depth, topographic setting, and proximity to oil and gas wells to identify possible relations to these factors. <p> <p> The presence of total coliform bacteria in groundwater is a potential indicator of surface contamination. The presence of Escherichia coli bacteria is indicative of fecal contamination of groundwater from either human or animal sources and may be considered an indicator of other related pathogens such as viruses. Total coliforms were detected in 26 of the 30 (87 percent) wells sampled. Eleven of the 30 (37 percent) wells sampled had detections of Escherichia coli bacteria. <p> <p> Sodium concentrations in 24 of 30 (80 percent) samples exceeded the U.S. Environmental Protection Agency (EPA) 20-milligram per Liter (mg/L) health-based value (HBV). Manganese, aluminum, and iron concentrations exceeded the EPA 50, 2.0, and 300 micrograms per liter (µg/L) secondary maximum contaminant level (SMCL) drinking-water standards at 14 (47 percent), 7 (23 percent), and 5 (17 percent) of the 30 wells sampled. Two of the 30 (7 percent) wells sampled had concentrations of manganese that exceeded the 300-µg/L USGS health-based screening level (HBSL). Arsenic concentrations at 7 of 30 (23 percent) wells sampled exceeded the 10-µg/L EPA maximum contaminant level (MCL) health-based drinking water standard. The EPA maximum contaminant level goal (MCLG) for arsenic is 0 µg/L and 29 of 30 wells sampled contained detectable concentrations of arsenic. <p> <p> None of the 30 wells sampled exceeded the U.S. Office of Surface Mining Reclamation and Enforcement (OSMRE) 28-mg/L immediate action level (IAL) for methane in groundwater and only 1 of 30 (3 percent) sites exceeded the 10-mg/L OSMRE level of concern (LOC) for methane in groundwater. Of the 28 wells sampled for radon-222 all 28 (100 percent) exceeded the EPA proposed 300-picocuries per liter (pCi/L) MCL for radon. None of the samples exceeded the 4,000-pCi/L alternate maximum contaminant level (AMCL) which is applicable to public drinking water systems that have adopted radon mitigation programs. <p> <p> Wilcoxon Signed Rank Tests indicated statistically significant differences at a 95 percent confidence interval (p less than 0.05) in radium-226, barium, and ethane groundwater concentrations with respect to the density of oil and gas wells present within a 500-meter (m) radius around the rural residential wells sampled for the study. Samples from residential wells that had four or fewer oil and gas wells in the surrounding 500-m radius had statistically lower concentrations of radium-226, bromide, and ethane than samples from residential wells sampled that had five or more oil and gas wells in the surrounding 500-m radius. Given the available data, the relationship between concentrations of radium-226, bromide, and ethane for wells sampled in this study and oil and gas development or natural geochemical processes is not clear. <p> <p> Groundwater-age tracers (chlorofluorocarbons, tritium, and sulfur hexafluoride) were sampled at 17 of the 30 wells. All 17 samples contained a fraction of young, post-1950s groundwater. Many of the groundwater samples collected for this study have high calcium to sodium ratios and low total dissolved solids concentrations, indicating they are dominated by recently recharged water. A subset of samples had chloride to bromide mass ratios between 70 and 200, indicating that deep Appalachian basin brines mixed with the shallow groundwater. For most of the samples in this study, the C1 through C6 hydrocarbons have characteristics that reflect a biogenic gas signature that has, to varying degrees, undergone oxidation processes during transport. None of the samples show a characteristic thermogenic cracking pattern among the hydrocarbon ratios. <p>
STORMWATER QUANTITY AND QUALITY, VA
Stormwater Quantity and Quality in Selected Urban Watersheds in Hampton Roads, Virginia, 2016–2020 <p> <p> Prepared in cooperation with the Hampton Roads Planning District Commission <p> <p> First posted November 23, 2022 <p> For additional information, contact: <p> Director, Virginia and West Virginia Water Science Center <p> https://www.usgs.gov/centers/virginia-and-west-virginia-water-science-ce nter <p> U.S. Geological Survey <p> 1730 East Parham Road <p> Richmond, Virginia 23228 <p> <p> Abstract <p> <p> Urbanization can substantially alter sediment and nutrient loadings to streams. Although a growing body of literature has documented these processes, conditions may vary widely by region and physiographic province (PP). Substantial investments are made by localities to meet federal, state, and local water-quality goals and locally relevant monitoring data are needed to appropriately set standards and track progress. In 2016, a long-term stormwater monitoring program was initiated to characterize water-quality and streamflow conditions and compute average annual nutrient- and sediment-loading rates across the three dominant land-use types—commercial (COM), high-density residential, and single-family residential (SFR)—in the Hampton Roads metropolitan region within the Coastal Plain PP in southeastern Virginia. This report summarizes the first five years of data collection to (1) assess patterns in streamflow and water chemistry across the three major land-use types in the region; (2) compute annual sediment and nutrient loads; and (3) compare annual loading rates to those in other urbanized regions. <p> <p> Patterns in watershed hydrology characteristics and conditions were similar to those observed in other urban monitoring studies. Base-flow indices were lower and stream flashiness indices were higher in the study watersheds compared to those in less developed reference watersheds. These patterns reflect a decrease in infiltration and consequent increase in storm runoff as a result of urbanization. Stream flashiness was strongly positively related to degree of impervious land cover and negatively to watershed area. Hydrologic metrics varied across the land-use gradient, reflecting greater and more rapid runoff in the COM watersheds than in SFR watersheds. Event-based analyses conducted exclusively on periods of runoff highlight longer duration events, longer time-to-peak streamflow, and a longer lag between peak precipitation and peak streamflow in SFR watersheds, and higher stormflow yields, runoff ratios, and peak flows in COM watersheds. Event-based metrics varied seasonally because of regional meteorological patterns. <p> <p> Concentrations of total suspended solids (TSS) and total phosphorus (TP) were positively correlated to streamflow, whereas concentrations of total nitrogen (TN) varied little across the hydrologic regime. Phosphorus composition varied spatially and seasonally—the proportion of orthophosphate (PO43-) was highest in samples collected from stations draining residential land-use types and was elevated in summer and fall. Nitrogen composition varied with hydrologic condition: nitrate plus nitrite (NO3-) dominance during base flow shifted to total organic nitrogen (TON) dominance during periods of runoff. For all three major constituents (TSS, TP, and TN), concentrations were highest in SFR watersheds, whereas yields were greatest in COM watersheds. This seeming contradiction in concentration and yield across land-use types occurred because of spatial differences in streamflow yield. <p> <p> The network average TSS yield in Hampton Roads was lower than that in comparable networks in Fairfax County, Virginia, and Gwinnett County, Georgia, a difference that may reflect dissimilarities in the topographic and soil characteristics of the Coastal Plain versus those in Piedmont PPs, as well as differences in engineered concrete stormwater conveyances versus earthen streams. The average annual TP yield in Hampton Roads was higher than averages reported in comparison studies and was primarily driven by elevated PO43-. Elevated PO43- yields may be related to unique soil and geological features of the Coastal Plain PP that limit phosphorus retention. Total nitrogen yields in the Hampton Roads and Fairfax County networks were similar; however, composition did vary, with greater total organic nitrogen yields in Hampton Roads and greater NO3- yields in Fairfax County. <p> <p> Cross-correlation analyses and mass-volume curves were used to assess the timing of sediment and nutrient loadings. The majority of TSS and TP was typically transported during the initial phase of a storm-runoff event, a phenomenon commonly termed the “first flush.” Although TN concentrations typically peaked within an hour of peak streamflow, reflecting the particulate dominance of TN during stormflows, and loadings were greater during the early phase of most storm events, the stricter first-flush criterion was rarely met. This suggests that the most abundant sources of TN in these watersheds are not as directly connected to the stormwater-conveyance system as are TSS and TP. <p>